When culture researchers get their hands dirty with code – first reflections from an interdisciplinary study of cultural events
Medialab's research project on culture cycles in Katowice, delivered as part of the Shared Circuits: Creative Momentum project, is now in its final stages. However, before the Medialab team and the invited experts present the full results of the study during the Data (for) Culture, the project’s manager Karol Piekarski comments on the activities already completed in an interview with Łukasz Mirocha.
Karol Piekarski, Łukasz MirochaInterview
- Łukasz Mirocha: Now that the project is nearing completion, what are your thoughts on the work on culture cycles in Katowice from the perspective of recent months? Which tasks have already been accomplished and which ones do we have to wait for until the December conference?
Karol Piekarski: We’ll have to wait even longer than December for the final results, if only because we’re still collecting and processing data to perform our intended analyses. However, we have already learned a lot about a dozen or so previously studied cultural events in Katowice.
- Have the preliminary results of the study been compiled yet?
We have created a draft report from the part of the project which describes, among other things, the specific nature of large Katowice festivals such as OFF and Nowa Muzyka. It is clear that they create value for the city in attracting visitors from outside Katowice, who are keen to visit the centre and spend far more money than the audiences of other events. We have also developed a tool for analysing and presenting data from Facebook pages of cultural institutions, and we have also prepared several other working prototypes, such as a tool for examining the geographical accessibility, which we intend to field test soon on larger data sets.
- Medialab seems to have kept busy throughout the summer holiday season. August saw the launch of Facebook application allowing users to answer questions related to their participation in Katowice cultural events. What is the app’s role in the project? Is it meant merge the two research areas, i.e. traditional surveys and Facebook data analysis?
Such is the premise, though the approach is largely an experiment, as we want to see if, and to what extent, this form of research is useful in cultural studies. After all, this is not a very popular solution in academic research, so the experience alone, not to mention the data collected, is very valuable to us.
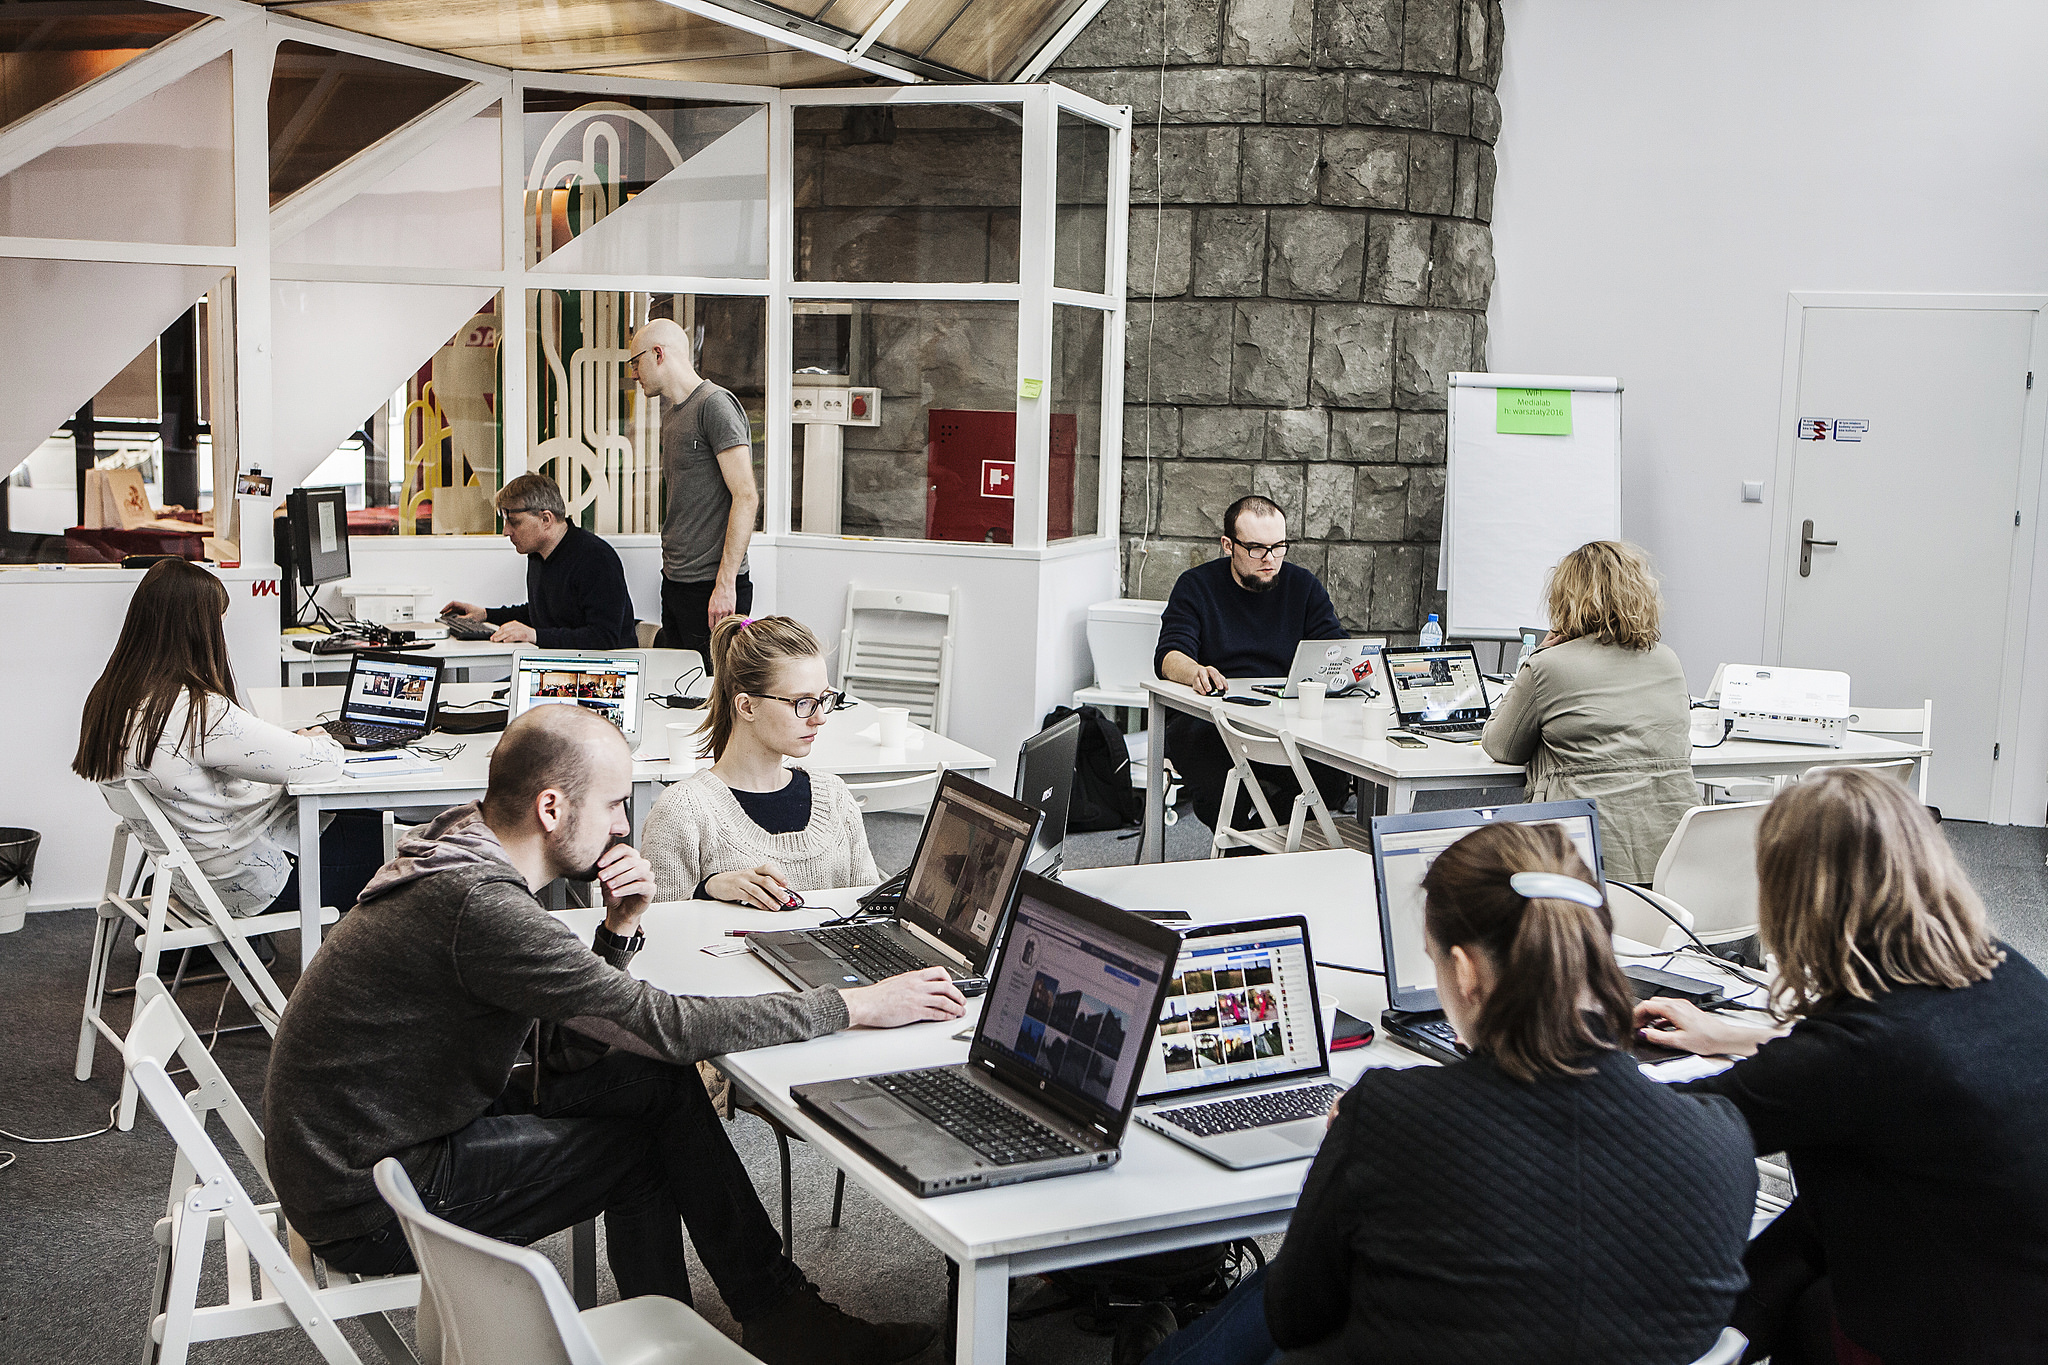
- From the early days, the project was delivered by an interdisciplinary team of programmers, designers and researchers. Have you succeeded in addressing the challenges of coordinating work within such a diverse environment?
I estimate that at least 40 percent of the time is spent on project management work, so it is important to prepare the workflow well: communication and documentation guidelines, data flow, etc.
Particularly challenging areas include data management and information flow among team members of different backgrounds and competences. In our study, the programmers and designers are always involved in the decision making process, while the researchers are intended to explore and understand the tools used by the analysts, developers, and designers.
Such joint work generates the best results. Another advantage is that we don’t need to involve everyone on a full-time basis – a few joint meetings and well maintained documentation are usually enough to allow other team members to control the project developments. Online tools, such as Google Docs, project management systems or GitHub, where you can always find the current version of your script or data, are of invaluable help under such conditions.
- How does such collaboration work in practice?
Once a research problem has been defined – be it the geographical accessibility of culture in Katowice – we usually call up a meeting of 3-4 people to throw some ideas on the table and later try to form some hypotheses and work out detailed assumptions. Meanwhile, we join our analysts and developers to try and search out the relevant content, using e.g. the Google Maps APIs, as the case may be with respect to accessibility research. Along the way, it takes a lot of time to clean up the data, mainly converting it to specific formats, so that it is compatible with other environments and programs.
We then perform a number of analyses, often using exploratory data visualisation, where we generate dozens of statistics and working graphs to see what comes out of the content (in our accessibility study, we liked to plunk the data into a map straight away to make it easier to spot some patterns and possible errors). It is essential that all team members should have access to these visualisations, regardless of whether they are involved in exploration. To this end, we create simple report prototypes, usually using the R Markdown library, which can be easily published online and then quickly updated as comments or new ideas arrive.
This content, supplemented by source data in appropriate formats (usually in csv or json text files), is then forwarded to graphic designers to work on visualisations and presentation layouts. Ultimately, the project is taken over by developers, who take care of the website with study results. Of course, discussions and consultations continue at all stages, as the project is always a team effort.
- As Medialab’s work is based on collaborations with experts, a number of workshops were held as part of the Shared Cities project to enhance the team members’ competences in e.g. data science and data organization. Looking back, how do you rate the value of such initiatives?
All these meetings were very important to us – sometimes we gained important programming skills, other times we performed analyses that led to interesting conclusions, and in some cases we simply discussed our research assumptions with our experts. For example, the research workshop on survey data analysis in R resolved many questions related to survey research. Also, our successful collaboration with Piotr Migdał to create prototype tools for researching Facebook content, led to the continuation of this partnership – our current joint project with Peter involves network analysis to investigate relationships between events based on similar interests of Facebook users.
- Was there a need to outsource certain tasks during the project?
We managed to complete about 90% of the work on our own. Thanks to the extensive skills of the team members and the training scheme that broadened our abilities. However, we have picked the brains of some top external experts on several occasions, because it is difficult to gain certain solid competences in a few weeks. Besides, such external collaborations at some stages of what is a very long research process are very refreshing and inspirational, also in terms of socialising.
- One form of working with people from outside the core team involved getting volunteers to conduct surveys. This was also one of the objectives, i.e. to create a methodology for working with data at a low cost. How do you rate this aspect from a few months’ perspective?
The coordination of these activities was taken care of by the regular members of our team: Matylda Badera, Magdalena Chmiel and Oskar Adamus. Somewhat counterintuitively, managing volunteer work is a major challenge that requires flexibility and soft skills (due to the high unpredictability of volunteer numbers on the day, quality of their work, etc.). It turned out, for example, that there is no point in putting a survey team together weeks in advance, as volunteers simply tend to quit in the meantime. On the other hand, what we have found to work is maintaining an ever-expanding database of volunteer contacts to draw on.
- Late June saw you hold an open meeting with representatives of cultural institutions which agreed to help carry out the study of their audiences. How far are their questions and possible reservations helpful in preparing a more useful final report?
We counted on the feedback from the institutions. The session was met with great interest and we had some interesting discussions. However, it can also be seen that it is difficult for the institutions involved to ask very inquisitive questions with only superficial knowledge of the results. Perhaps this kind of initiatives should take place in two stages: we present the results, the teams have time to discuss them and work out their questions, and then the follow-up part of the study continues regarding their specific observations.
- At this stage, are you able to reveal some of the results and research themes that will be presented in full form during the December conference?
We are currently working on the report and the exhibition. All those interested in particular topics – such as visualisations, data analysis and research methodologies – are welcome to read the blog posts, which are the best source of information about our activities. I also encourage everyone to attend the December Data (for) Culture event, during which we will not only show the visualisations, maps, etc., but also discuss many important research observations with our invited guests. Our exhibition is designed to both give a casual visitor the opportunity to learn the study results within a few minutes by watching a short animation, and provide a cultural worker or researcher with in-depth knowledge of the project – all, as we hope, in an engaging form.


